2005-10-10
Completed draft 0 of interactive diagramming tool.
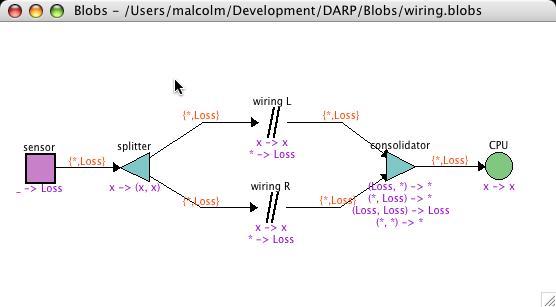
University term has just started today, so I'm feeling the potential pressure of getting snowed under with teaching commitments, so this was my last real chance to get some significant coding finished on my most recent tool project. Over the last couple of years, I've been developing the theory of FPTC - Failure Propagation and Transformation Calculus. It is a method for analysing safety-critical systems designs that consist of both software and hardware components. Essentially, you determine the failure modes of each component and communications mechanism, in response to any failures in their environment. So then you annotate each element of your design diagram with an expression denoting its failure behaviour. The calculus then allows the whole system behaviour to be determined automatically. I already had the calculus engine (written in Haskell) for some time now. But although it generated SVG diagrams as output, for input it used a textual description of the diagrams, and so was quite fiddly to use - it would take forever to layout a diagram by manually adjusting coordinates and stuff, then running the batch tool to see the result, rinse and repeat.
So, over the summer I came across Dazzle, a graphical tool for Bayesian analysis, written in Haskell using the wxWidgets toolkit. There was a paper about it at the Haskell Workshop 2005 in Tallinn. And I thought - hey, I need something just like that. Luckily, Arjan who is one of the authors is a nice chap, and although he could not release the entire source code to me, he spent an afternoon stripping Dazzle down to just the diagram editor, with no analysis backend, and sent it to me, calling it "Blobs". Fantastic! I didn't need to start a design from scratch, and didn't need to learn wxWidgets from scratch either. Just start tweaking the code and see what happens!
Well, today after only about a month's effort, I'm finally happy that Blobs, with my analysis engine plugged in, gives me the same results as I had before, with the same pretty output diagrams. But now it takes only minutes to draw a new diagram instead of hours. Click a button and the analysis is performed instantly. Very satisfying. And really, Arjan's Blobs code in Haskell was a joy to work with - totally easy to understand and modify.
Of course, this is only version 0. I still have much more in the analysis engine (tracing, probability) than I ever worked out how to display even on SVG diagrams. But these were difficult before in the batch-mode tool, mainly because of the tedious way needed to specify exactly what you wanted. It should be a lot smoother in an interactive setting.
# posted by malcolm @ 19:42 
![]()

